
DISTRICT REPORTS GAINS IN SEAGRASS COVERAGE IN SARASOTA BAY
SARASOTA, FL – Scientists with the Southwest Florida Water Management District’s (District) Surface Water Improvement and Management (SWIM) program have released the results of the 2024 seagrass mapping study, revealing that Sarasota Bay has seen an increase of 1,912 acres of seagrass beds since 2022. This marks a 19% increase over the past two years.
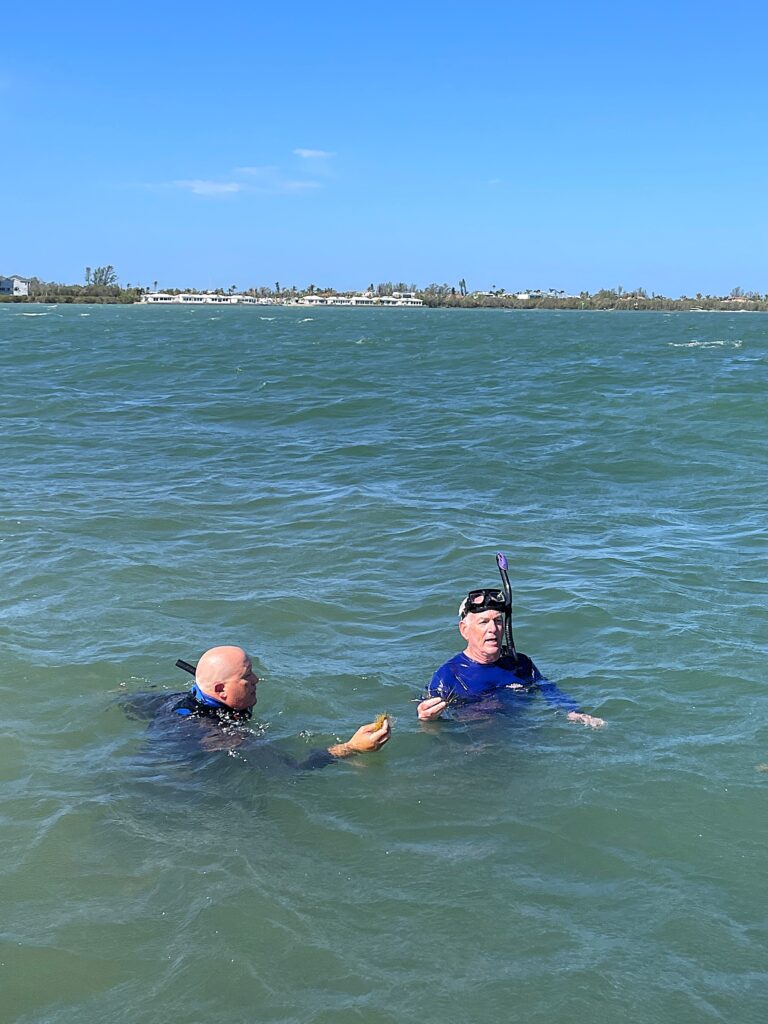
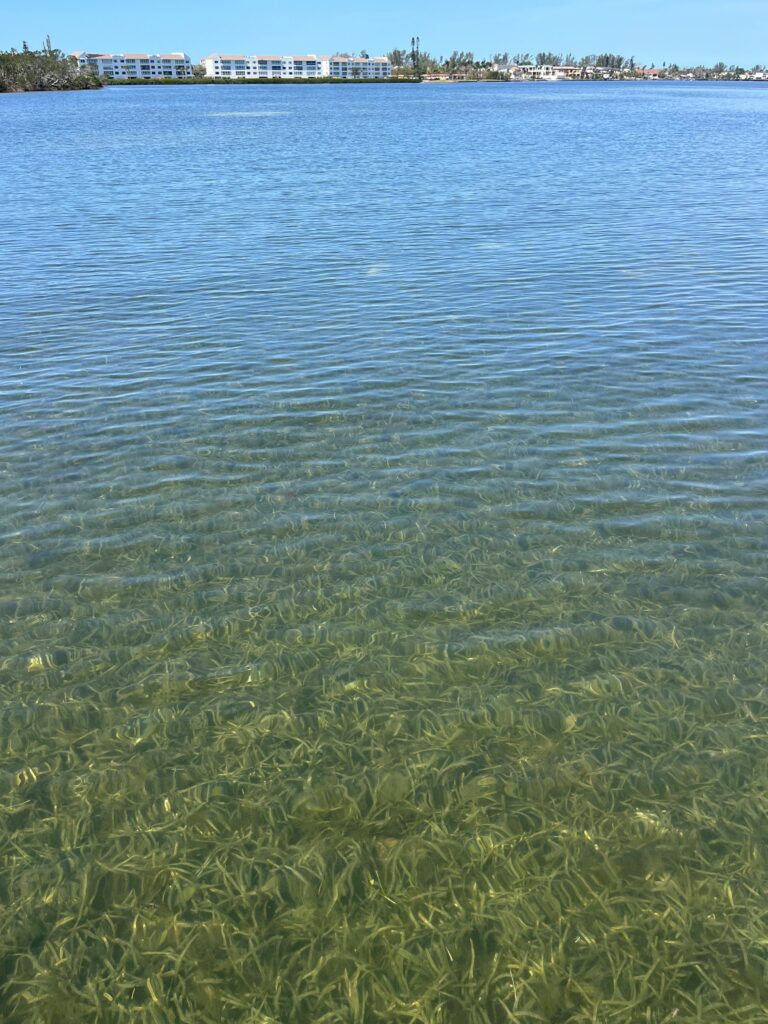
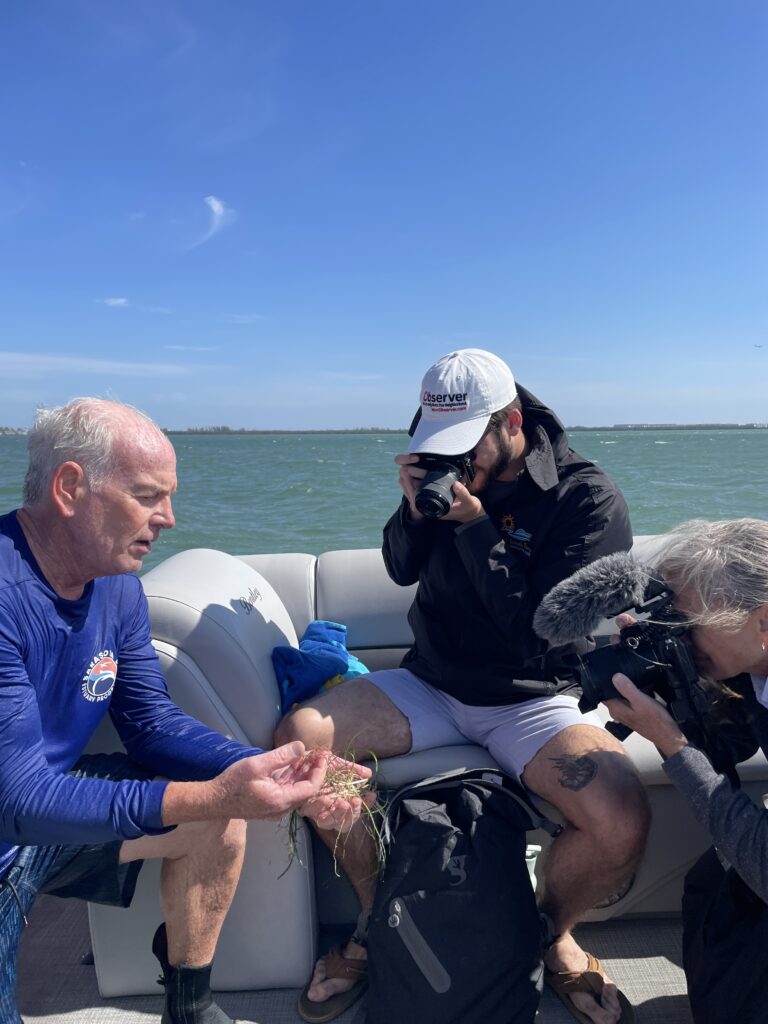
The District’s seagrass mapping efforts were conducted in the winter of 2024. Since being surveyed, Sarasota Bay has endured a myriad of severe weather events, including Hurricanes Helene and Milton. On Friday, March 28, staff from the District and Sarasota Bay Estuary Program (SBEP) visited Upper Sarasota Bay to view the area’s largest acreage increase. It appears that last year’s severe weather events did not significantly impact the recovered areas. The SBEP plans to further assess the health of the beds through annual site visits and programs like Eyes on Seagrass.
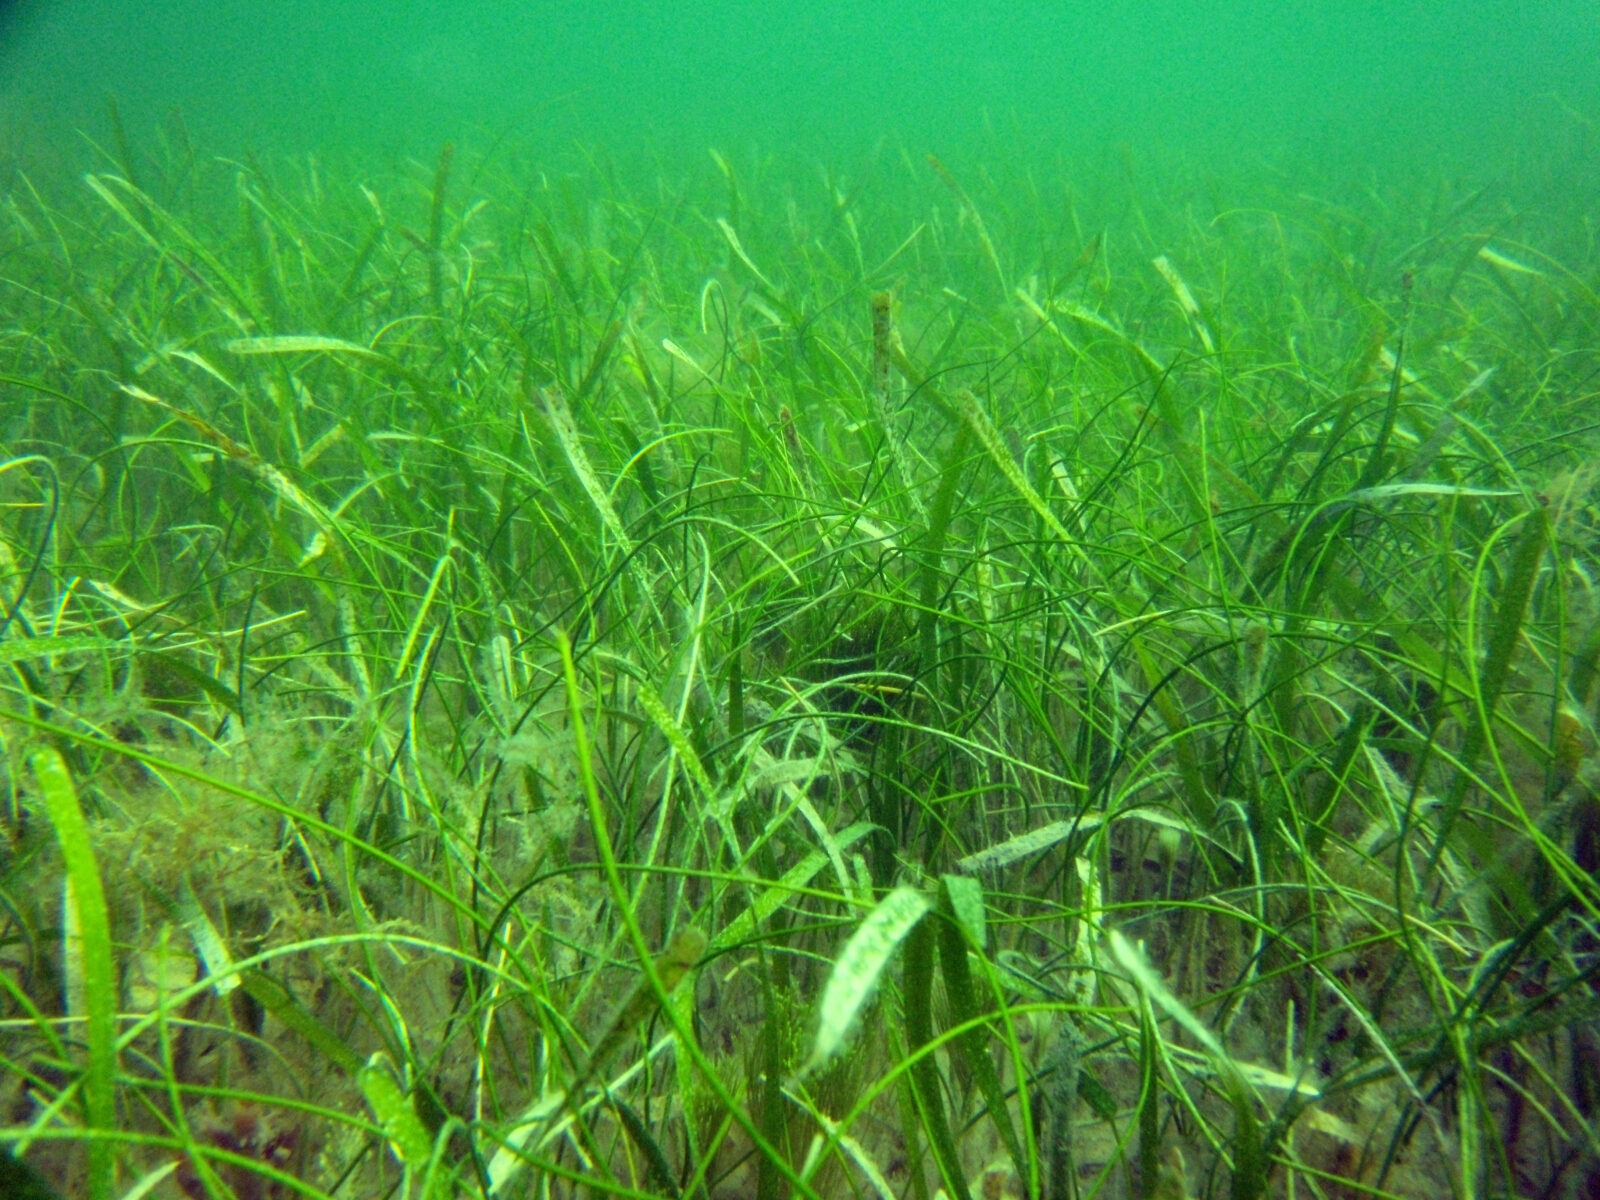
“There is quite a bit of macroalgae out there, maybe a bit more than we’d like to see, but the seagrass underneath is doing well.” Said Dr. Chris Anastasiou, Chief Water Quality Scientist and Seagrass Mapping Lead for the District. “The gains we saw in Sarasota Bay proper are very encouraging. We still aren’t back to where we were in 2016, but hopefully, these trends will continue, and we will get there. Seagrass in areas around Longbar Point came back with a vengeance,” said Dr. Anastasiou.

Fish and Wildlife Benefits
Seagrasses are a critical indicator of the ecological health of Sarasota Bay, as they require clean water to thrive and are highly sensitive to changes in water clarity and quality. Healthy seagrass beds provide essential habitats that support a diverse range of marine species. According to researchers at Florida Atlantic University, there are approximately 40,000 fish found in the average acre of seagrass. Charismatic megafauna,such as manatees and green sea turtles, depend on seagrasses as a primary food source and benefit from gains across estuaries like Sarasota Bay.
Basis for Improvements
The SBEP works with local governments and researchers to assess and respond to the needs of Sarasota Bay. Staff at the SBEP attribute recent seagrass increases to specific management actions that improved water quality. “Increases did not come about due to transplanting or drought. The increases arose from natural recruitment, based on multiple years of improving water quality,” said Dr. Dave Tomasko, Executive Director of the SBEP. Dr. Tomasko highlights that local governments’ investments in wastewater and stormwater infrastructure have been crucial in reducing nitrogen loads to the bay. The Sarasota Bay Estuary Program also underscores the importance of community-level stewardship, including bay-friendly fertilizer use and seagrass-safe boating practices, which can also help to support and maintain these increases.
Seagrass Data and Maps
The District’s seagrass mapping program, which began in 1988, uses aerial photographs and field surveys every two years to track trends in seagrass coverage and assess ongoing water quality improvement efforts. The data collected is an essential tool for measuring the biological integrity of the Bay’s estuaries and guiding future conservation efforts. Sarasota Bay encompasses five bay segments spanning Manatee and Sarasota counties. Seagrass is mapped and reported for each bay segment. Click here to view the maps for 2022 and 2024.
Sarasota Bay Seagrass Acreage
| Sarasota Bay Segment | 1988 (acres) | 2016 (acres) | 2018 (acres) | 2020 (acres) | 2022 (acres) | 2024 (acres) | % Change in Acreage 2022 to 2024 |
| Palma Sola Bay | 1,111 | 1,258 | 1,273 | 1,216 | 1,200 | 1,240 | 3% |
| Sarasota Bay | 6,323 | 10,659 | 10,326 | 8,075 | 7,591 | 9,424 | 24% |
| Roberts Bay | 334 | 361 | 349 | 332 | 300 | 304 | 1% |
| Little Sarasota Bay | 533 | 806 | 610 | 607 | 578 | 603 | 4% |
| Blackburn Bay | 411 | 390 | 295 | 307 | 294 | 305 | 4% |
| Total | 8,712 | 13,473 | 12,853 | 10,539 | 9,964 | 11,876 | 19% |
Seagrass Acreage in Suncoast Estuaries Mapped by SWFWMD
| Suncoast Estuary | 2022 (acres) | 2024 (acres) | Acreage Change | % Change |
| St. Joseph Sound/Clearwater Harbor | 17,815 | 18,007 | 192 | +1% |
| Tampa Bay | 30,137 | 31,544 | 1,407 | +5% |
| Sarasota Bay | 9,963 | 11,876 | 1,913 | +19% |
| Lemon Bay | 2,427 | 2,417 | -10 | <1% |
| Charlotte Harbor | 14,913 | 14,020 | -893 | -6% |
Overall Ecosystem Health
Each year, the SBEP publishes an Ecosystem Health Report Card to track conditions in each of the five bay segments. Seagrass is one of the four ecosystem indicators used in the analysis. The most recent update to the Report Card showed that all bay segments were either in excellent or good condition. More information about the Report Card is available at www.sarasotabay.org/report-card
### About the Sarasota Bay Estuary Program: The Sarasota Bay Estuary Program is a cooperative partnership among communities, researchers, and governments that strives to improve the health of Sarasota Bay and enhance the area’s natural resources for public benefit. Learn more at www.sarasotabay.org